An interactive music venue map
I am currently working on research project that is looking at live music in our home city of Birmingham, UK. As part of that work I’ve been exploring the API of Songkick in an attempt to generate an initial map of the music venues in the city.
Songkick is a service that provides discovery and ticket sales for live music events worldwide. Through their website and mobile app users can track touring artists, receive alerts for concerts in their area, and purchase tickets to shows. Their API provides access to data for over 6 million concerts. My aim with exploring their API was to see what information could be gathered that might help us begin to understand the landscape of live music in Birmingham.
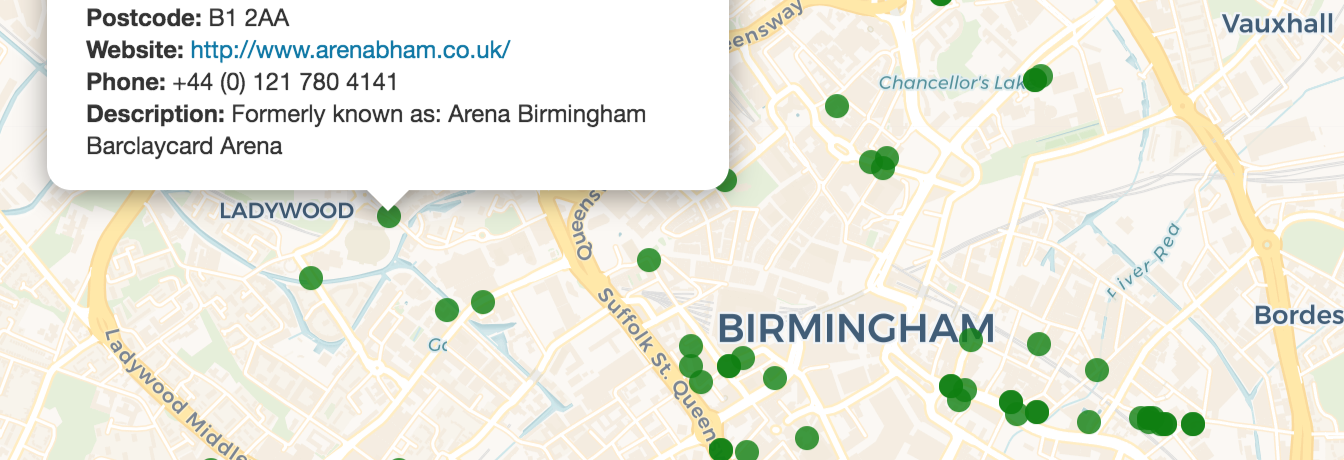
Over the last week – and following quite a bit of trial and error! – I have managed to create a workflow that pulls data from Songkick API and creates interactive map of music venues. Before starting that process, I had looked around online to see if anyone else had tried something similar (and – I hoped – had then been inclined to create a walkthrough tutorial). Since I was unable to find much at all around Songkick and R, I have created a walkthrough tutorial of my own.
You can read the tutorial in full over on my website.
The process of learning how to call data from the Songkick API and then prepare it for use in a map has been enjoyable and satisfying. I started with a basic question (how can I plot a map of music venues?) and ended up with something approaching a solution. I also picked up some new skills along the way, which always makes a process worthwhile.
I’ll be posting more information about the research project in due course, including details of some events we have planned.
Dr Craig Hamilton